
Red Cross using Climate Centre met-watching tool in Venezuela quake zone
By Juan Bazo, Climate Centre Focal Point for the Americas
When the earthquake hit Venezuela last month, we quickly reminded ourselves of the challenge that often goes unnoticed during the first few hours of an emergency.
Weather conditions can directly influence the safety of affected people and the ability of teams to provide assistance. With that in mind, we developed an interactive dashboard that allows local Red Cross and IFRC teams to quickly and easily access up-to-date weather information for the areas affected by the earthquake in Venezuela: the states of La Guaira, Caracas, Miranda, Carabobo and Yaracuy.
The main objective is to transform weather data into actionable information that supports planning and decision-making for the response.
For each location, users can check the forecast for a full week ahead, including temperature, precipitation and the likelihood of rain, wind speeds, and cloud cover – all presented through indicators, tables and interactive graphs that can be quickly interpreted by people with no meteorological training.
IFRC Americas Regional Director Loyce pace says the tool is helping the teams “join the dots” between the quake response and other work that was already a priority. “For families whose home is now a tarp or a tent, rains and winds matter even more than usual. So does heat, particularly for older people or others with health risks,” she said on social media yesterday.
“And with El Niño active across the continent, extreme conditions can turn an already difficult situation into an even more harmful or unbearable one for people.”
‘What science and data give them is lead time
and a better chance at success’
One of the most important features of the dashboard is its alert system based on impact thresholds: the platform continuously analyses forecasts and generates warnings when weather conditions could affect humanitarian operations.
For example, if heavy rain is forecast the system warns of the possible increase in the risk of flooding, landslides or difficulties in accessing communities.
When high winds are expected, it warns of possible damage to tents and other temporary structures. It also identifies episodes of extreme heat or indeed cold nights that could pose a risk to displaced people or outdoor workers.
Loyce continued: “The tool shapes ordinary decisions too, like when to distribute critical supplies, taking into account heightened needs or risks.
“But none of this replaces just showing up. No dashboard builds shelters and mobile clinics or delivers cooking and sanitation kits.
“Our volunteers and partners remain on the ground, providing critical community services and support. What science and data give them is lead time and a better chance at success.”
The dashboard was developed to be fully accessible on PCs, tablets or mobile phones and without the need to install any software.
The information is automatically updated using almost real-time data, ensuring teams always have the latest forecasts.
The tool is not intended to replace official notices from the authorities; it’s a complementary resource that brings open-source scientific information closer to the humanitarian effort.
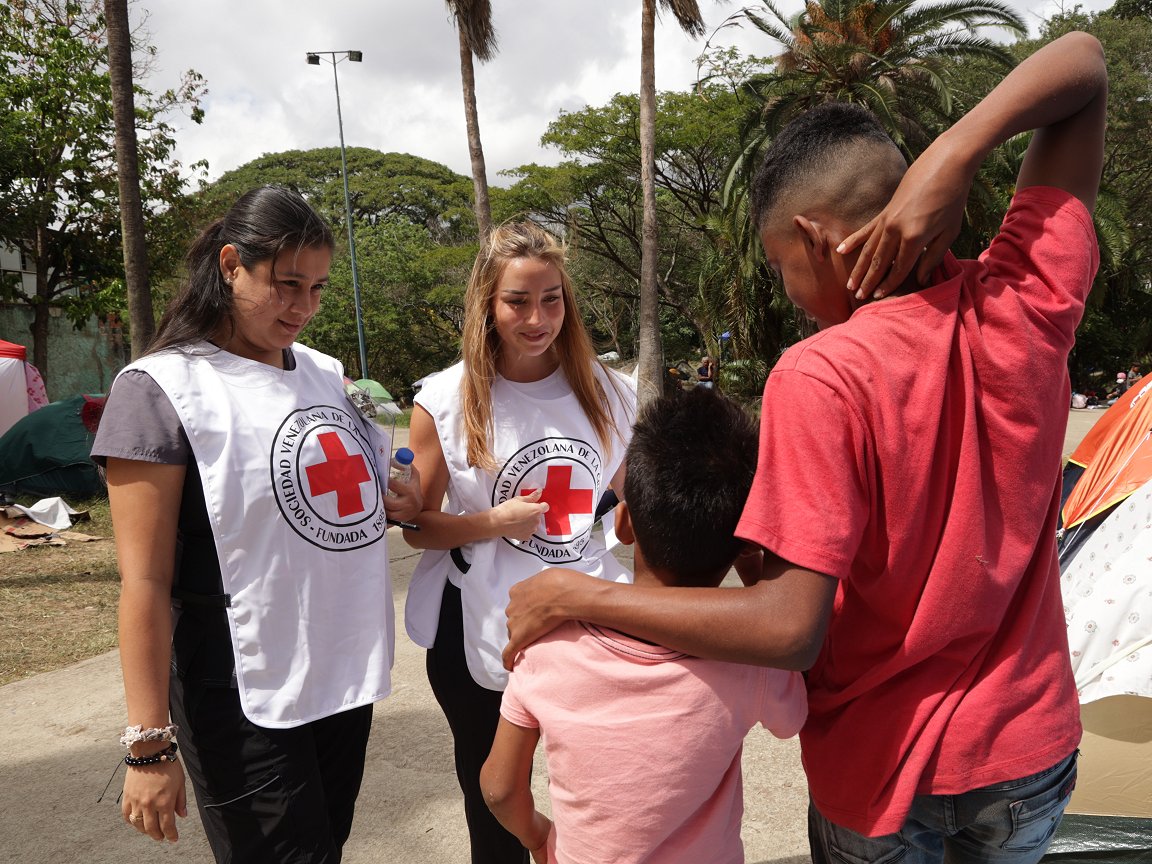
A joint quake response assessment by the Venezuelan and German Red Cross in Caracas, ahead of psychosocial support for adults and children. When people affected by disasters are living in tents – and also relying on a humanitarian operation at least partly run from tents or temporary structures – the weather becomes an even more important factor, but one for which forecasts are now more easily accessible thanks to a new Climate Centre online tool. (Photo: Venezuela Red Cross via IFRC)